Your code runs, the output is wrong, and you can’t see why. Here is how to use breakpoints: click the margin beside a line, start the debugger, and inspect variables when execution pauses.
Breakpoints are a core skill within the wider field of debugging techniques, and this guide covers the basics for beginners.
| Item | Value |
|---|---|
| Start debugging in Visual Studio | F5 key |
| Step Over in Visual Studio | F10 key |
| Step Into in Visual Studio | F11 key |
| Step Out in Visual Studio | Shift + F11 keys |
| Enabled breakpoint icon in VS Code | Filled red circle |
| Breakpoint the debugger could not register in VS Code | Hollow gray circle |
These figures come from the Microsoft Learn Visual Studio debugger overview and the Visual Studio Code debugging guide. Shortcuts and icons can change between versions and debuggers, so check the source before you rely on them.
What is a breakpoint?
A breakpoint pauses your application at a specific point so that you can inspect its state, as the Visual Studio Code debugging guide describes it. Instead of guessing from output, you freeze the program mid-run and look at what it holds.
The Visual Studio debugger overview calls breakpoints the most basic and essential feature of reliable debugging. They are the feature every other debugger tool builds on.
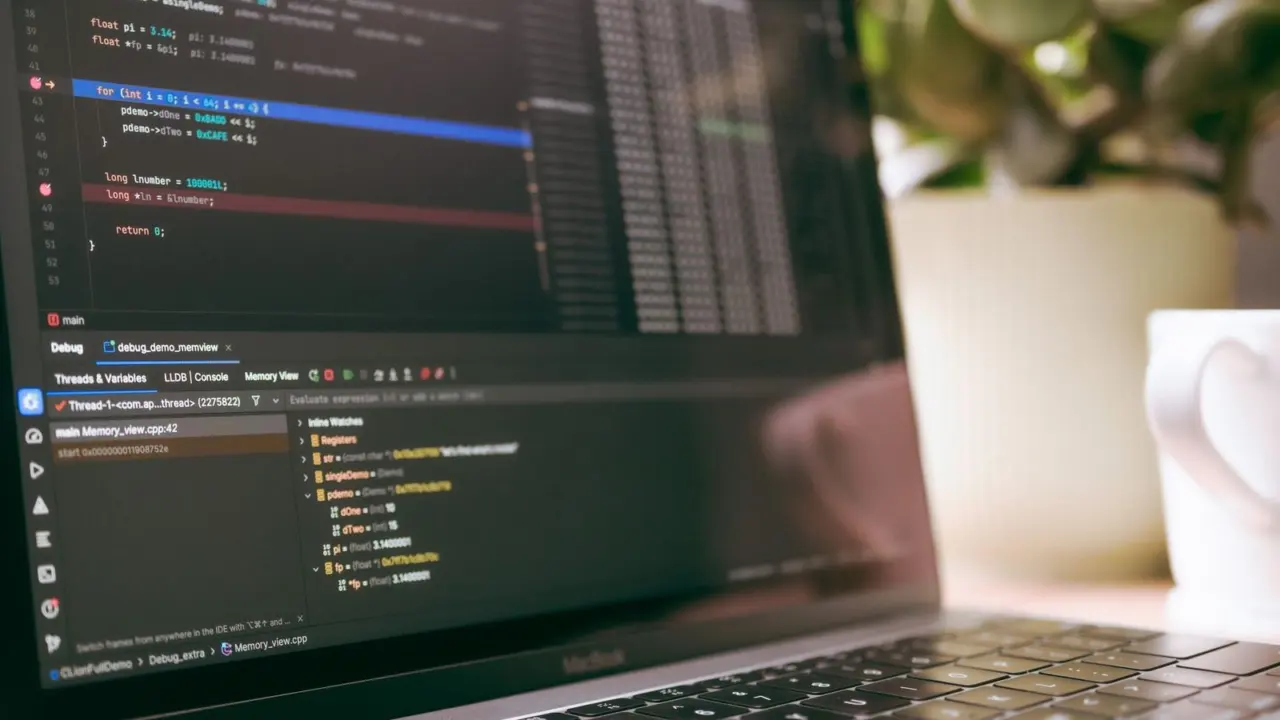
The paused line has not run yet. In Visual Studio, a yellow arrow marks the statement where the debugger paused, and that statement isn’t yet executed, according to the same Microsoft Learn page.
A debugger lets you look at all the values in your program instead of guessing which ones to track by logging to the console, as LaunchCode’s Java course puts it. The side-by-side look at print debugging vs debugger shows when each approach fits.
Set your first breakpoint
The steps below follow the flow in the Visual Studio Code debugging guide. Other editors and IDEs use the same idea with slightly different menus.
- Open the source file that you want to debug.
- Select the editor margin next to a line of executable code. A red circle marks the breakpoint.
- Start debugging, or open the Run and Debug view and select Run and Debug.
- When execution pauses, read the values in the Variables section and the function calls in the Call Stack section.
- Use the Debug toolbar to continue, step through code, restart the application, or stop.
In Visual Studio, pressing F5 is the most common way to start debugging, per the Microsoft Learn overview. It runs until the first breakpoint it meets.
Pick a line just before the value goes wrong, not the very top of the program. If the wrong value is already present when you pause, move the breakpoint earlier. If it is still correct, move it later.
A hollow gray circle means the debugger could not register the breakpoint. The VS Code guide says this might happen when the line has no executable code or the debugger does not support the source file.
Step through code: over, into and out
Once the program is paused, you move forward one small piece at a time. In Visual Studio, Step Over is F10, Step Into is F11, and Step Out is Shift + F11, as listed in the Microsoft Learn overview.
The VS Code guide describes the toolbar actions like this:
- Continue: resume execution until the next breakpoint.
- Step Over: run the current line without stepping into function calls on that line.
- Step Into: step into the function called on the current line.
- Step Out: finish the current function and pause in the calling function.
Step Over is the safe default. It still runs the function, so the code executes, but you skip the detail you don’t care about.
Switch to Step Into when the line you’re paused on calls the suspicious function. Use Step Out when you’ve seen enough and want to return to the caller.
Breakpoint types beyond the basic line
A plain line breakpoint is enough for many bugs. The VS Code guide notes that debugger extensions determine which breakpoint types and conditions they support, so check what yours offers.
- Conditional breakpoint: pauses execution only when a specified condition is met, such as an expression that evaluates to true, or a hit count.
- Triggered breakpoint: enabled after another breakpoint is hit. Use one when a failure occurs only after a specific code path or application state.
- Function breakpoint: pauses when execution enters a function, which helps when you know the name but don’t have the source open. It appears as a red triangle.
- Data breakpoint: pauses when the value of a variable changes, is read, or is accessed. It appears as a red hexagon.
- Logpoint: writes a message to the Debug Console without pausing execution. It appears as a diamond-shaped icon.
Logpoints let you inspect values without adding logging statements to your source code. They are available only when the debugger extension implements them, per the same guide.
Conditional and triggered breakpoints suit bugs that show up rarely, because they ignore every harmless pass through the code. The guide on how to debug intermittent bugs goes further on that situation.
The JetBrains Guide adds another option: rather than manually setting breakpoints, you can set a breakpoint to handle JavaScript exceptions so the debugger pops up when you hit a problem. It also says you can set conditions so you only pause when a condition is true or after the breakpoint has been hit a number of times.
Habits that keep breakpoints useful
Breakpoints are cheap to add, which makes them easy to forget. The JetBrains Guide warns that a breakpoint is still there after you reopen a file, even if you close the IDE completely, so it is easy to lose track of breakpoints in big projects.
- Review the list. Use the Breakpoints section in VS Code to enable, disable, edit, or remove breakpoints. In JetBrains IDEs, the View Breakpoints dialog lets you delete ones you are not using.
- Disable, don’t delete, when unsure. A filled gray circle indicates a disabled breakpoint in VS Code, so you can bring it back later.
- Watch one value. The JetBrains Guide describes watches as a way to focus on a single variable or expression as you step.
- Expect differences. Breakpoint behavior can vary by debugger and programming language.
When you find the cause, remove the breakpoints you added and rerun the program without the debugger. That confirms the fix works in normal conditions, not only while paused.
Frequently asked questions
What is the difference between Step Over and Step Into?
Show answer
Step Over runs the current line without stepping into function calls on that line, while Step Into steps into the function called on the current line. This is how the VS Code guide defines them.
Why is my breakpoint a hollow gray circle?
Show answer
Treat it as a warning that the breakpoint never attached, so the program will not stop there. Move it to a line that holds a real statement, then confirm your debugger supports the file type.
Can I see values without pausing the program?
Show answer
Yes, with a logpoint. It writes a message to the Debug Console without pausing execution, but only when your debugger extension implements logpoints.
Do breakpoints work the same in every debugger?
Show answer
No. The VS Code guide states that breakpoint behavior can vary by debugger and programming language, so check which types yours supports.